
Microtransit vs Macrotransit
By: Krishan Puri
Cars still dominate transportation, especially for travel to employment. In America only 5 percent of work commuters use public transit. This statistic has largely remained unchanged for thirty years. Only in the past few years have policy makers realized that maintaining the status quo approach to transportation has not been sufficient.
Recently a new wave of technologies and commercial products have hit the global market for public transit, causing all sorts of disruption. Services like Uber and Lyft have caused concerns of competition and declining ridership, ubiquitous smart phones, and cheap communications have contributed to the growth of a new concept called microtransit. It is already a controversial term for some public transit industry members, Jarett Walker, a public transit consultant has made several statements on microtransit including:
“To succeed, microtransit would have to help people get around cities better, not just make them feel good about hailing a ride on a phone.” – Jarret Walker, 2018
Last year, Streetsblog did a take down of microtransit, noting that microtransit consistently ended up performing only as well as paratransit service, which tends to be the most expensive and least efficient service model transit agencies provide. The Streetsblog piece highlighted one of the most spectacular failures attributed to microtransit, the dubious Kansas City pilot operated by Bridj, where the average cost was around $1000 per trip.
This post also reviews the results seen from different potential solutions that address public transit used for employment travel. Specifically we compare the operational statistics generated by recent microtransit projects to Pantonium’s performance in Belleville, Ontario. Our technology suite can deliver reliable on-demand transportation in a way that is as efficient or even more efficient than fixed route bus services in some urban areas.
We call this macrotransit, the core aspects of this concept that differentiates it from microtransit, or mobility services such as dial-a-bus and ride-hailing are:
-
Use of large vehicles (40 foot buses)
-
Use of existing public transit stop infrastructure
-
Continuous global optimization
This video and this blog post provide a detailed explanation of macrotransit. The application of this concept is simple once it is understood that the principle goal is to maximize vehicle productivity, while maintaining complete flexibility of routes. Everything else, as Mr. Walker put it, is just making people feel good about ordering trips on a smart phone, and does not contribute to improved efficiency for transit agencies. The relative difference in results of this approach can be seen by comparing several prominent projects and their baseline ridership performance in low density areas.
Comparing Performance in Belleville and Austin to 2015 National Averages
There have been noticeable attempts by municipalities throughout North America to experiment with microtransit. Among those is Belleville, Ontario – powered by Pantonium and Austin, Texas using Via. This section will review Austin’s performance and Belleville’s performance.
Service Area:
- Belleville’s service area is 25 square km serving a population of approximately 20,540 riders
- Austin’s is 19.1 square km servicing a population of 24,643 riders
Service Hours:
- Belleville operating for 45.5 hours per week
- Austin operating for 67 hours per week
Cost per Trip:
- $21 per trip in Austin
- $4.60 per trip in Belleville
- Austin: $5135/week
- Belleville: $3,735/week
- Belleville is spending on average $1400 less per week than Austin while completing nearly three times as many rides per week
Average Ridership
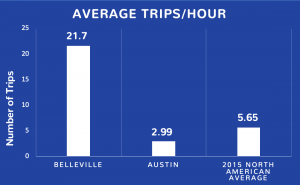
Belleville is completing an average of 812.6 rides per week compared to Austin’s 244.55 rides per week. On average, Belleville is completing roughly three times the amount of trips/week as Austin despite operating 21.5 fewer hours per week.
- Belleville: 3134.4 trips/month (peak = 4375 Jan 2019)
- Austin: 1850 trips/month (peak = 3209 June 2018) *note this is reported data from 5 operational months in Belleville vs. 11 operational months in Austin
Other Approaches to Microtransit
See Innisfil STAFF REPORT NO: DSR-038-19 DATE: March 13, 2019
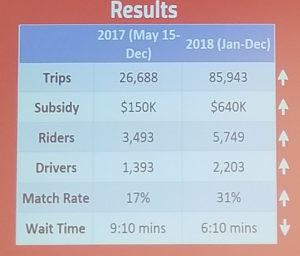
Presented here is some relevant data from the Innisfil, Ontario pilot partnership with Uber. The data presented by Innisfil and Uber jointly demonstrates what most public transit officials already know: using transportation network companies like Uber and Lyft to deliver public transit is not much different that using a taxi service, since global optimization is not achieved. The most telling statistic here is the “Match Rate” – the actual percentage of trips that were shared between two separate riders. Despite using UberPool’s algorithm, only 31 percent of trips were shared. Ironically, this outcome of 69 percent of riders taking solo trips is very similar to the overall percentage of people who drive alone during their commute in North America, which hovers around 70 percent. Essentially, Innisfil is paying Uber to maintain the status quo. Unfortunately we cannot find information on the actual hours of driver time, which would show Uber’s true productivity as they attempt to provide public transit in Innisfil. The fact that driver hours is not made publicly available suggests that Uber simply does not care about how long drivers work for, as neither Uber nor Innisfil pay for driver time (their shareholders bare this burden). What we do know is the per trip cost in Innisfil is still higher than Pantonium’s macrotransit service in Belleville, which should be considered by any other city considering a taxi model for public transit.
The key takeaway here is that transit planners have been correct in their skepticism of a technological panacea based on the results of the four years of microtransit projects throughout North America. We have not found evidence of any project performing better than average paratransit services – except our project in Belleville. We believe that Pantonium has developed and deployed the world’s most productive and cost effective on-demand transit service. If any public or private transit operation is currently using fixed routes or microtransit services that fall below 18-30 riders per hour contact us at info@pantonium.com to find out about macrotransit.
Sources:
https://www.apta.com/resources/statistics/Documents/FactBook/2017-APTA-Fact-Book.pdf (1)
https://www.surtc.org/transitfactbook/downloads/2017-rural-transit-fact-book.pdf (2)
Austin RFP Attachments (3)
https://www.transit.dot.gov/sites/fta.dot.gov/files/docs/ntd/66011/2016-ntst.pdf (4)
Featured Image: Matthias Ripp Urban Traffic

One Comment